It has been my practice for the last two
decades to take a detailed look at how risk varies across countries,
once at the start of the year and once mid-year. In most years, the
differences between the two updates are small, and often ignorable, but
this year's update brings significant changes for many reasons. The
first is the retreat of risk capital, which I talked about in my last
post, not only affects the flow of capital and repricing of the riskiest
assets (high yield bonds, money losing companies) within each asset
class, but also has consequences for the flow of capital across
geographies, with riskier countries feeling the effect more than safer
countries. The second is that this has been a consequential year for
country risk shifts, with Russia's invasion of Ukraine upending risk not
only for those countries, but also in the region, and tumult in Sri
Lanka and Pakistan playing out as risk to investors in both countries.
Country Risk: Drivers and Measures
An
investment in Nigeria or Turkey clearly exposes a firm or investor to
more risks than an otherwise similar investment in Germany or Canada,
but why? Some of the differences can be traced to the stability and
growth prospects of the underlying economies, some to political and
legal structures and some to geography. Rather than provide a laundry
list, I attempted to summarize the four key drivers of country risk
differences in the table below:
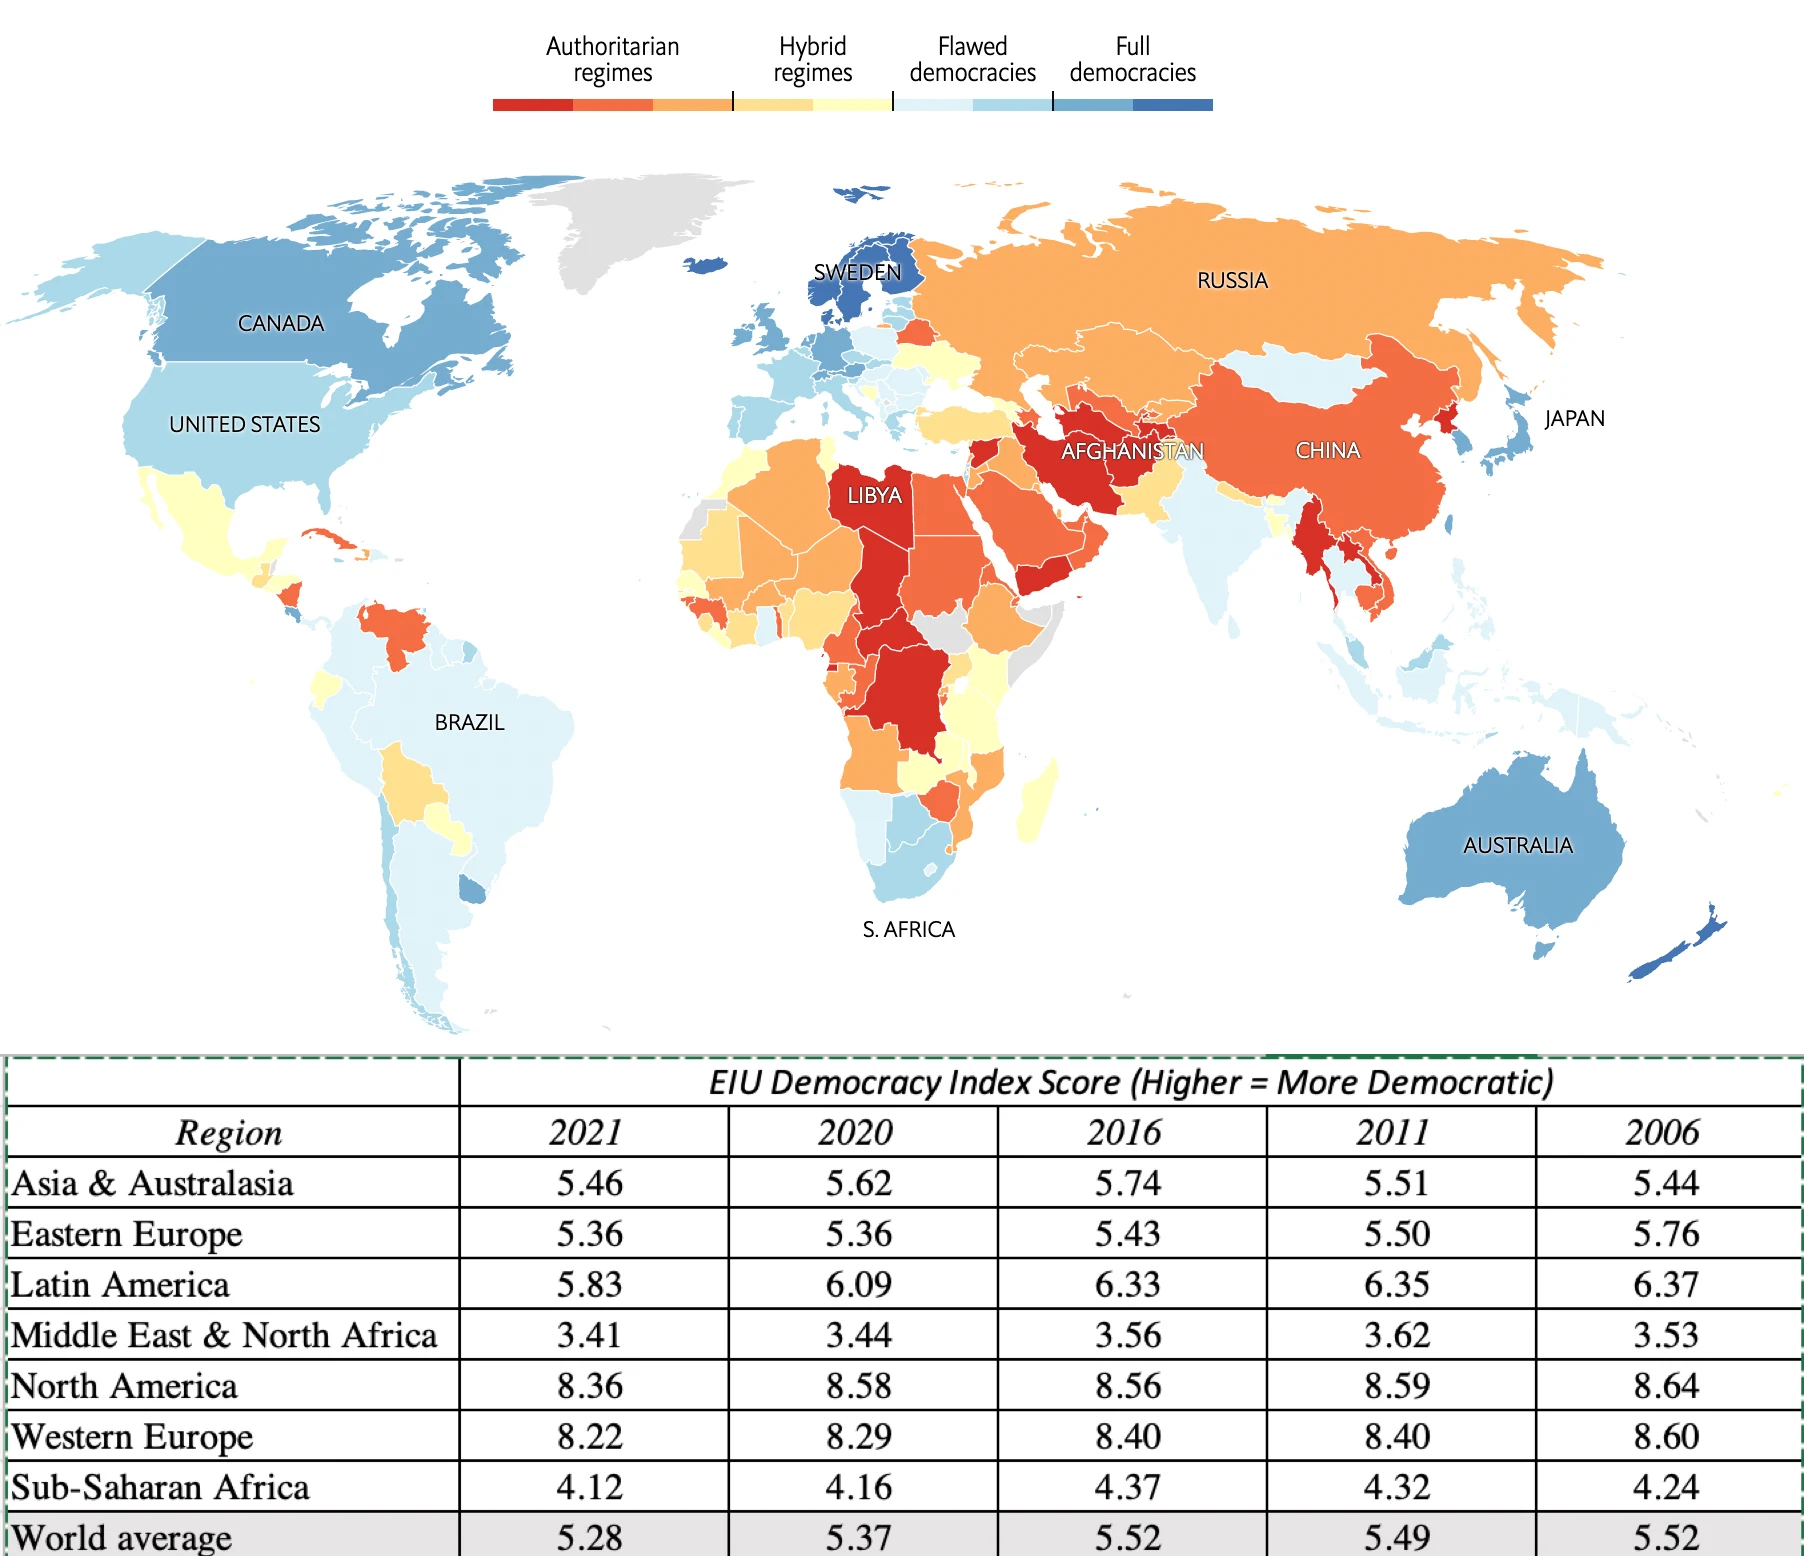
Let’s start with political structure,
i.e., the extent of political freedom and democracy in a country, a
sensitive topic and one that is open to subjective measurements, and
draw on a democracy index score computed by the Economist Intelligence
Unit (EIU) every year, with the most recent one mapped below:
 |
| Source: Economist Intelligence Unit (EIU) |
As
the Economist noted, a third of the world's population lived under
authoritarian regimes and only 6.4% lived under full democracy, in 2021,
with large differences across regions. From a business risk standpoint,
though, the question of whether you would rather operate in a democracy or a dictatorship is a complicated one,
with the former creating more continuous risk, as laws and regulations
change, as elections often bring in new governments, and the latter more
discontinuous risk, since regime changes, though less frequent, are
often more wrenching and painful.
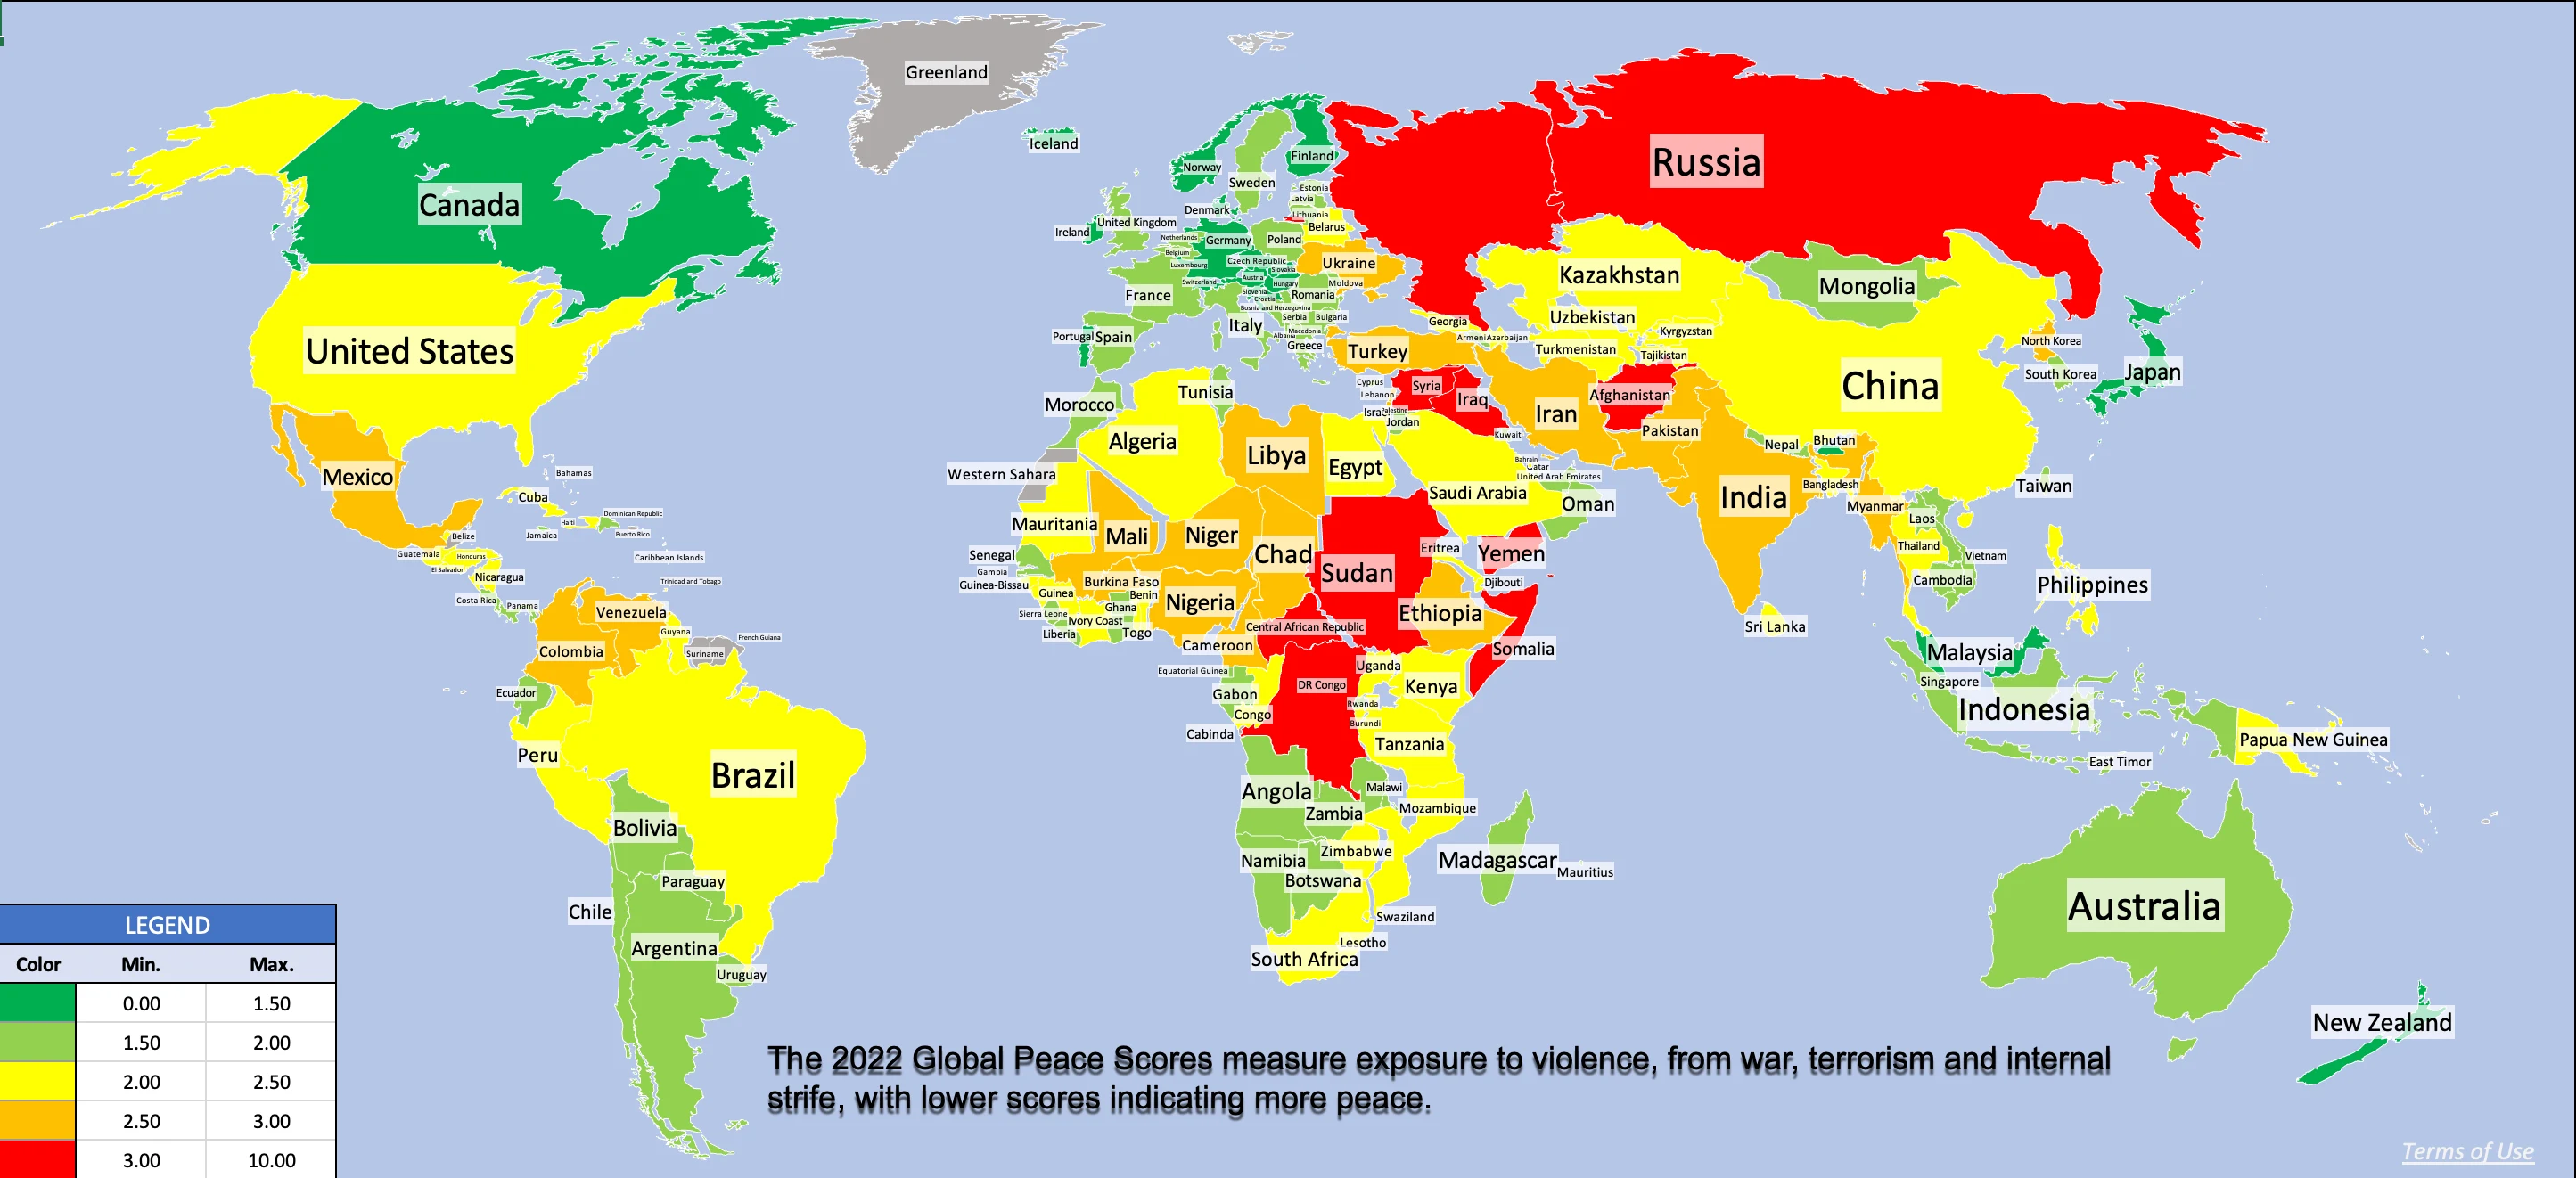
Second, a country’s risk profile can also be affected by its exposure to violence,
from war, terrorism or internal strife, and the risks that ensue to
businesses that operate in its midst, I looked at differences across
countries, in July 2022, drawing on work done by the Institute for Peace
and Economics:
 |
| Source: Institute for Peace and Economics |
Note that the peace scores were updated to reflect the Russian invasion of Ukraine and that the world's hotspots became more violent in 2021 and 2022.
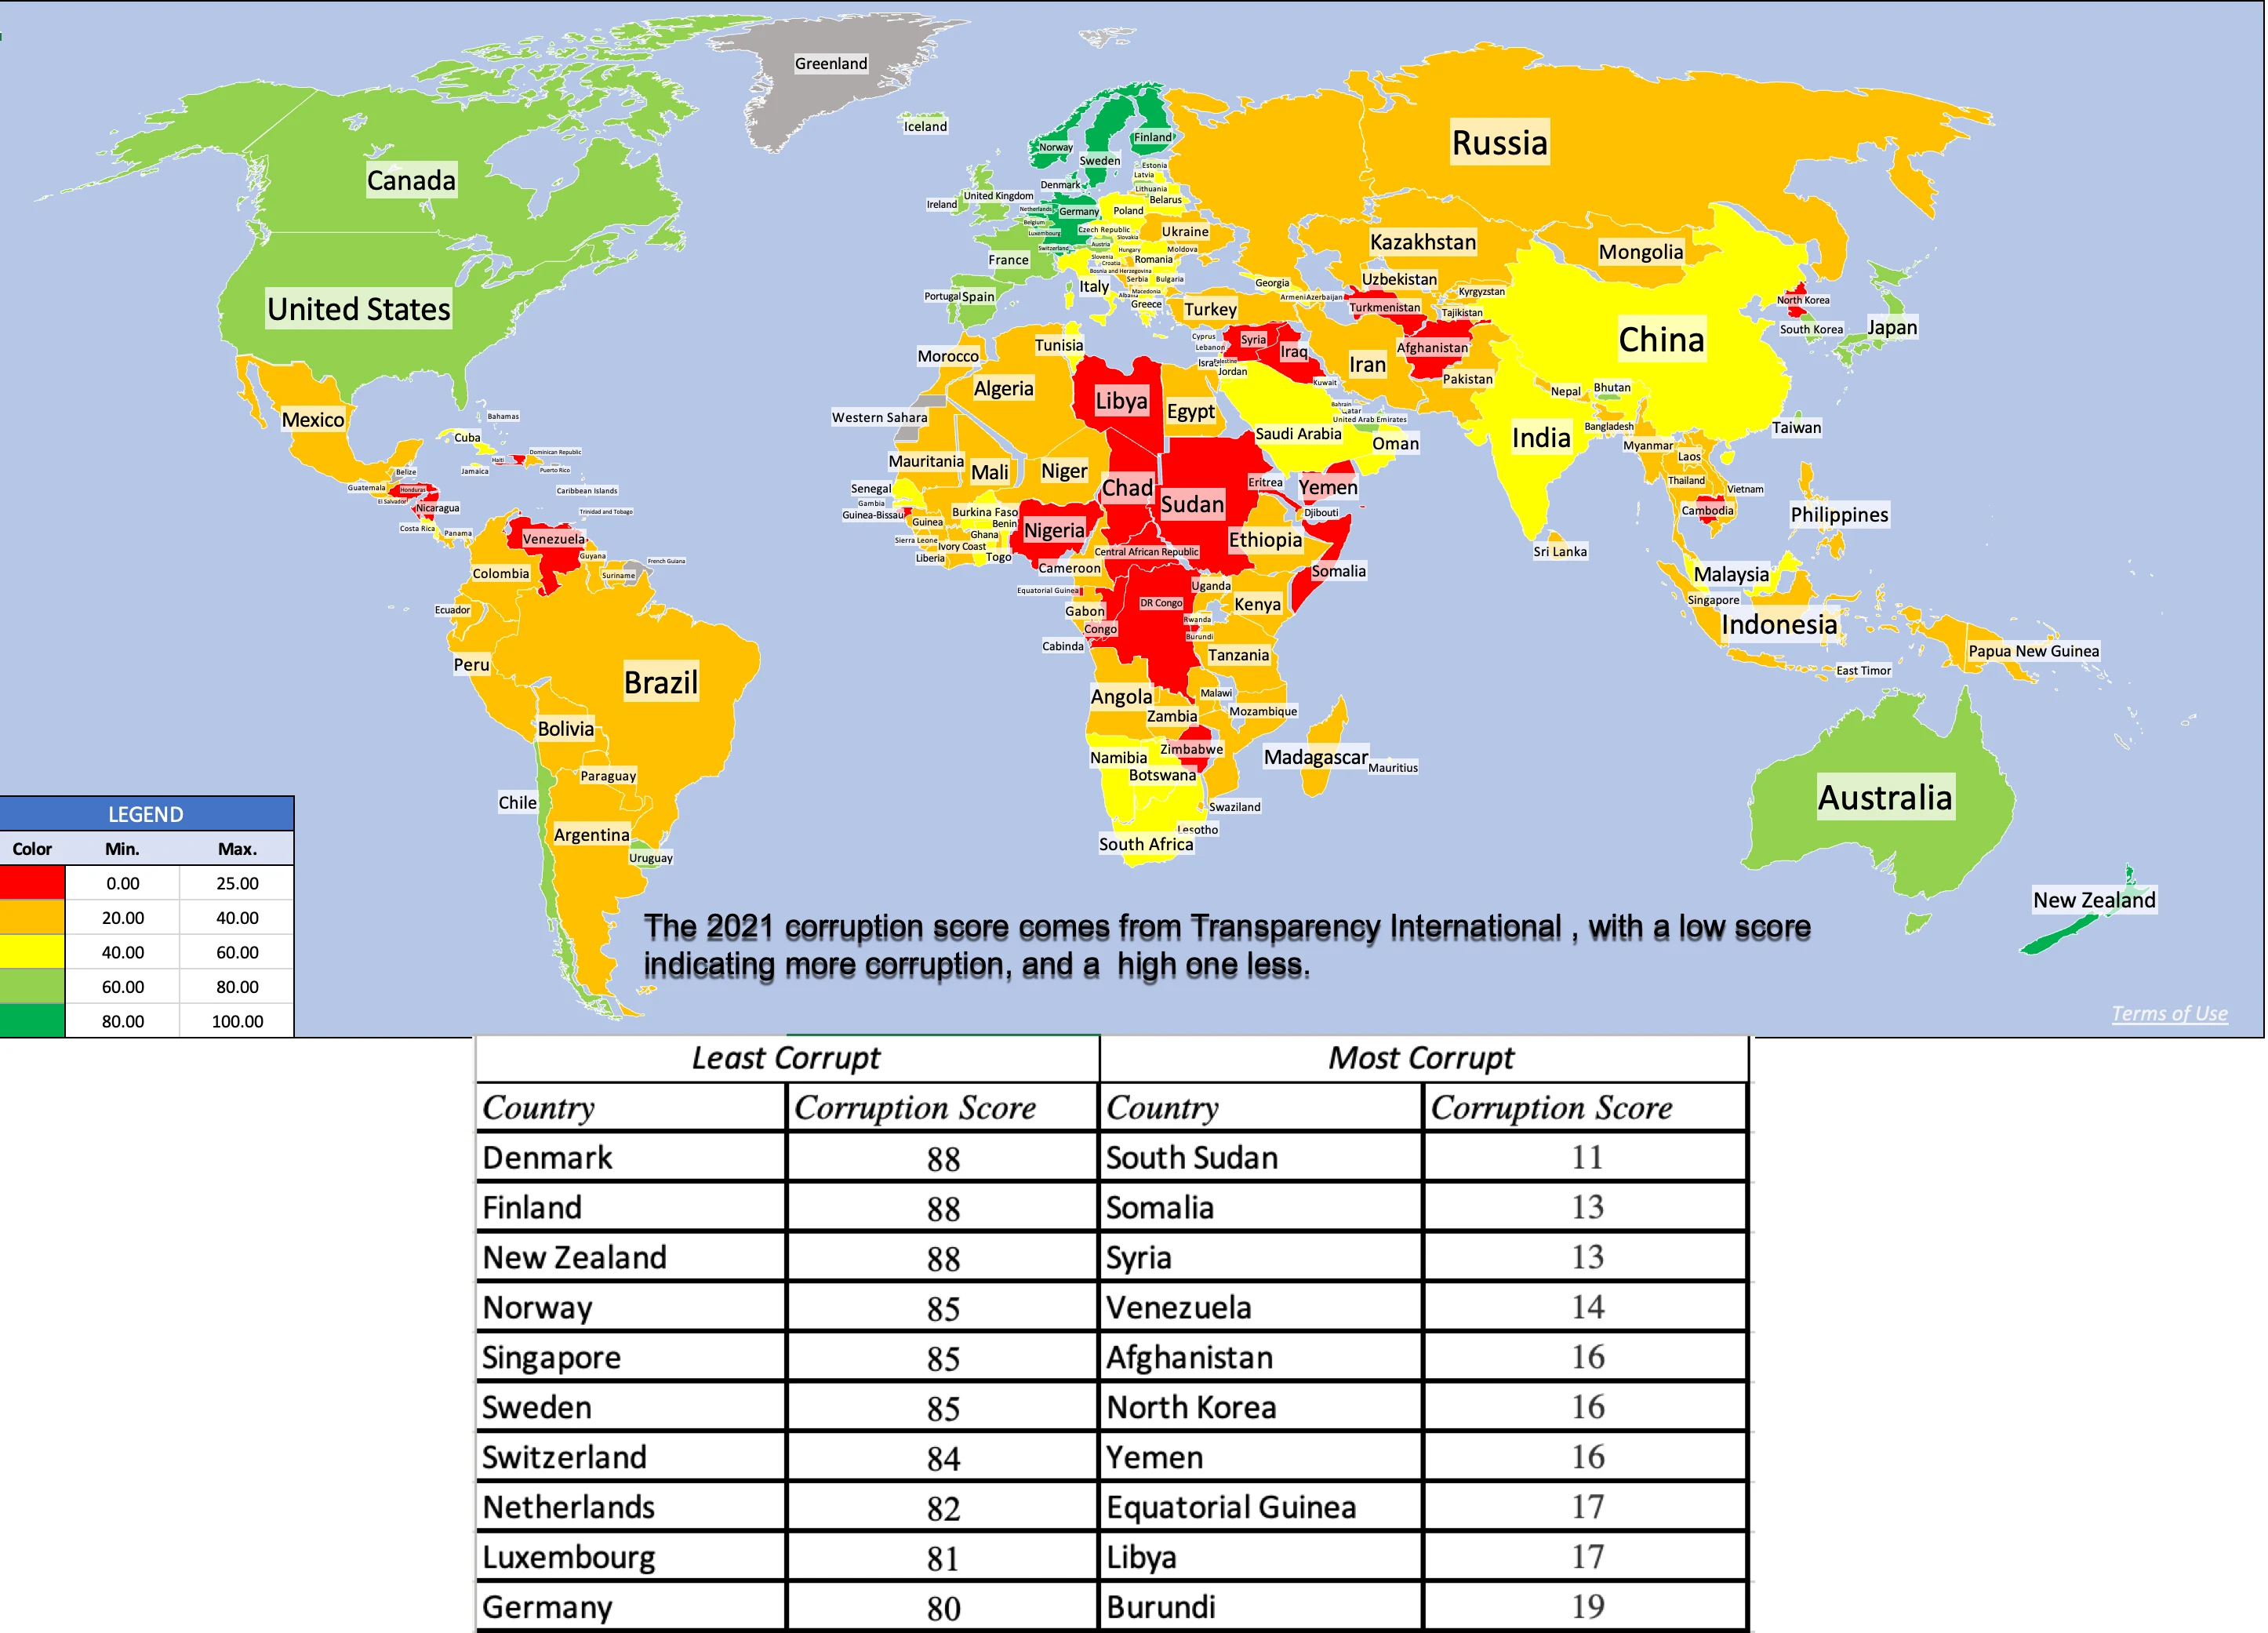
Third, corruption operates as an implicit tax, since business operating in corrupt parts of the world have to build in the associated costs and constraints. Transparency International measures a corruption score for countries, and the results of its 2021 iteration are mapped below:
 |
| Source: Transparency International |
Northern
Europe is the standout, when it comes to being free of corruption, but
corruption clearly is a drag on businesses in Latin America, Africa and
much of Asia.
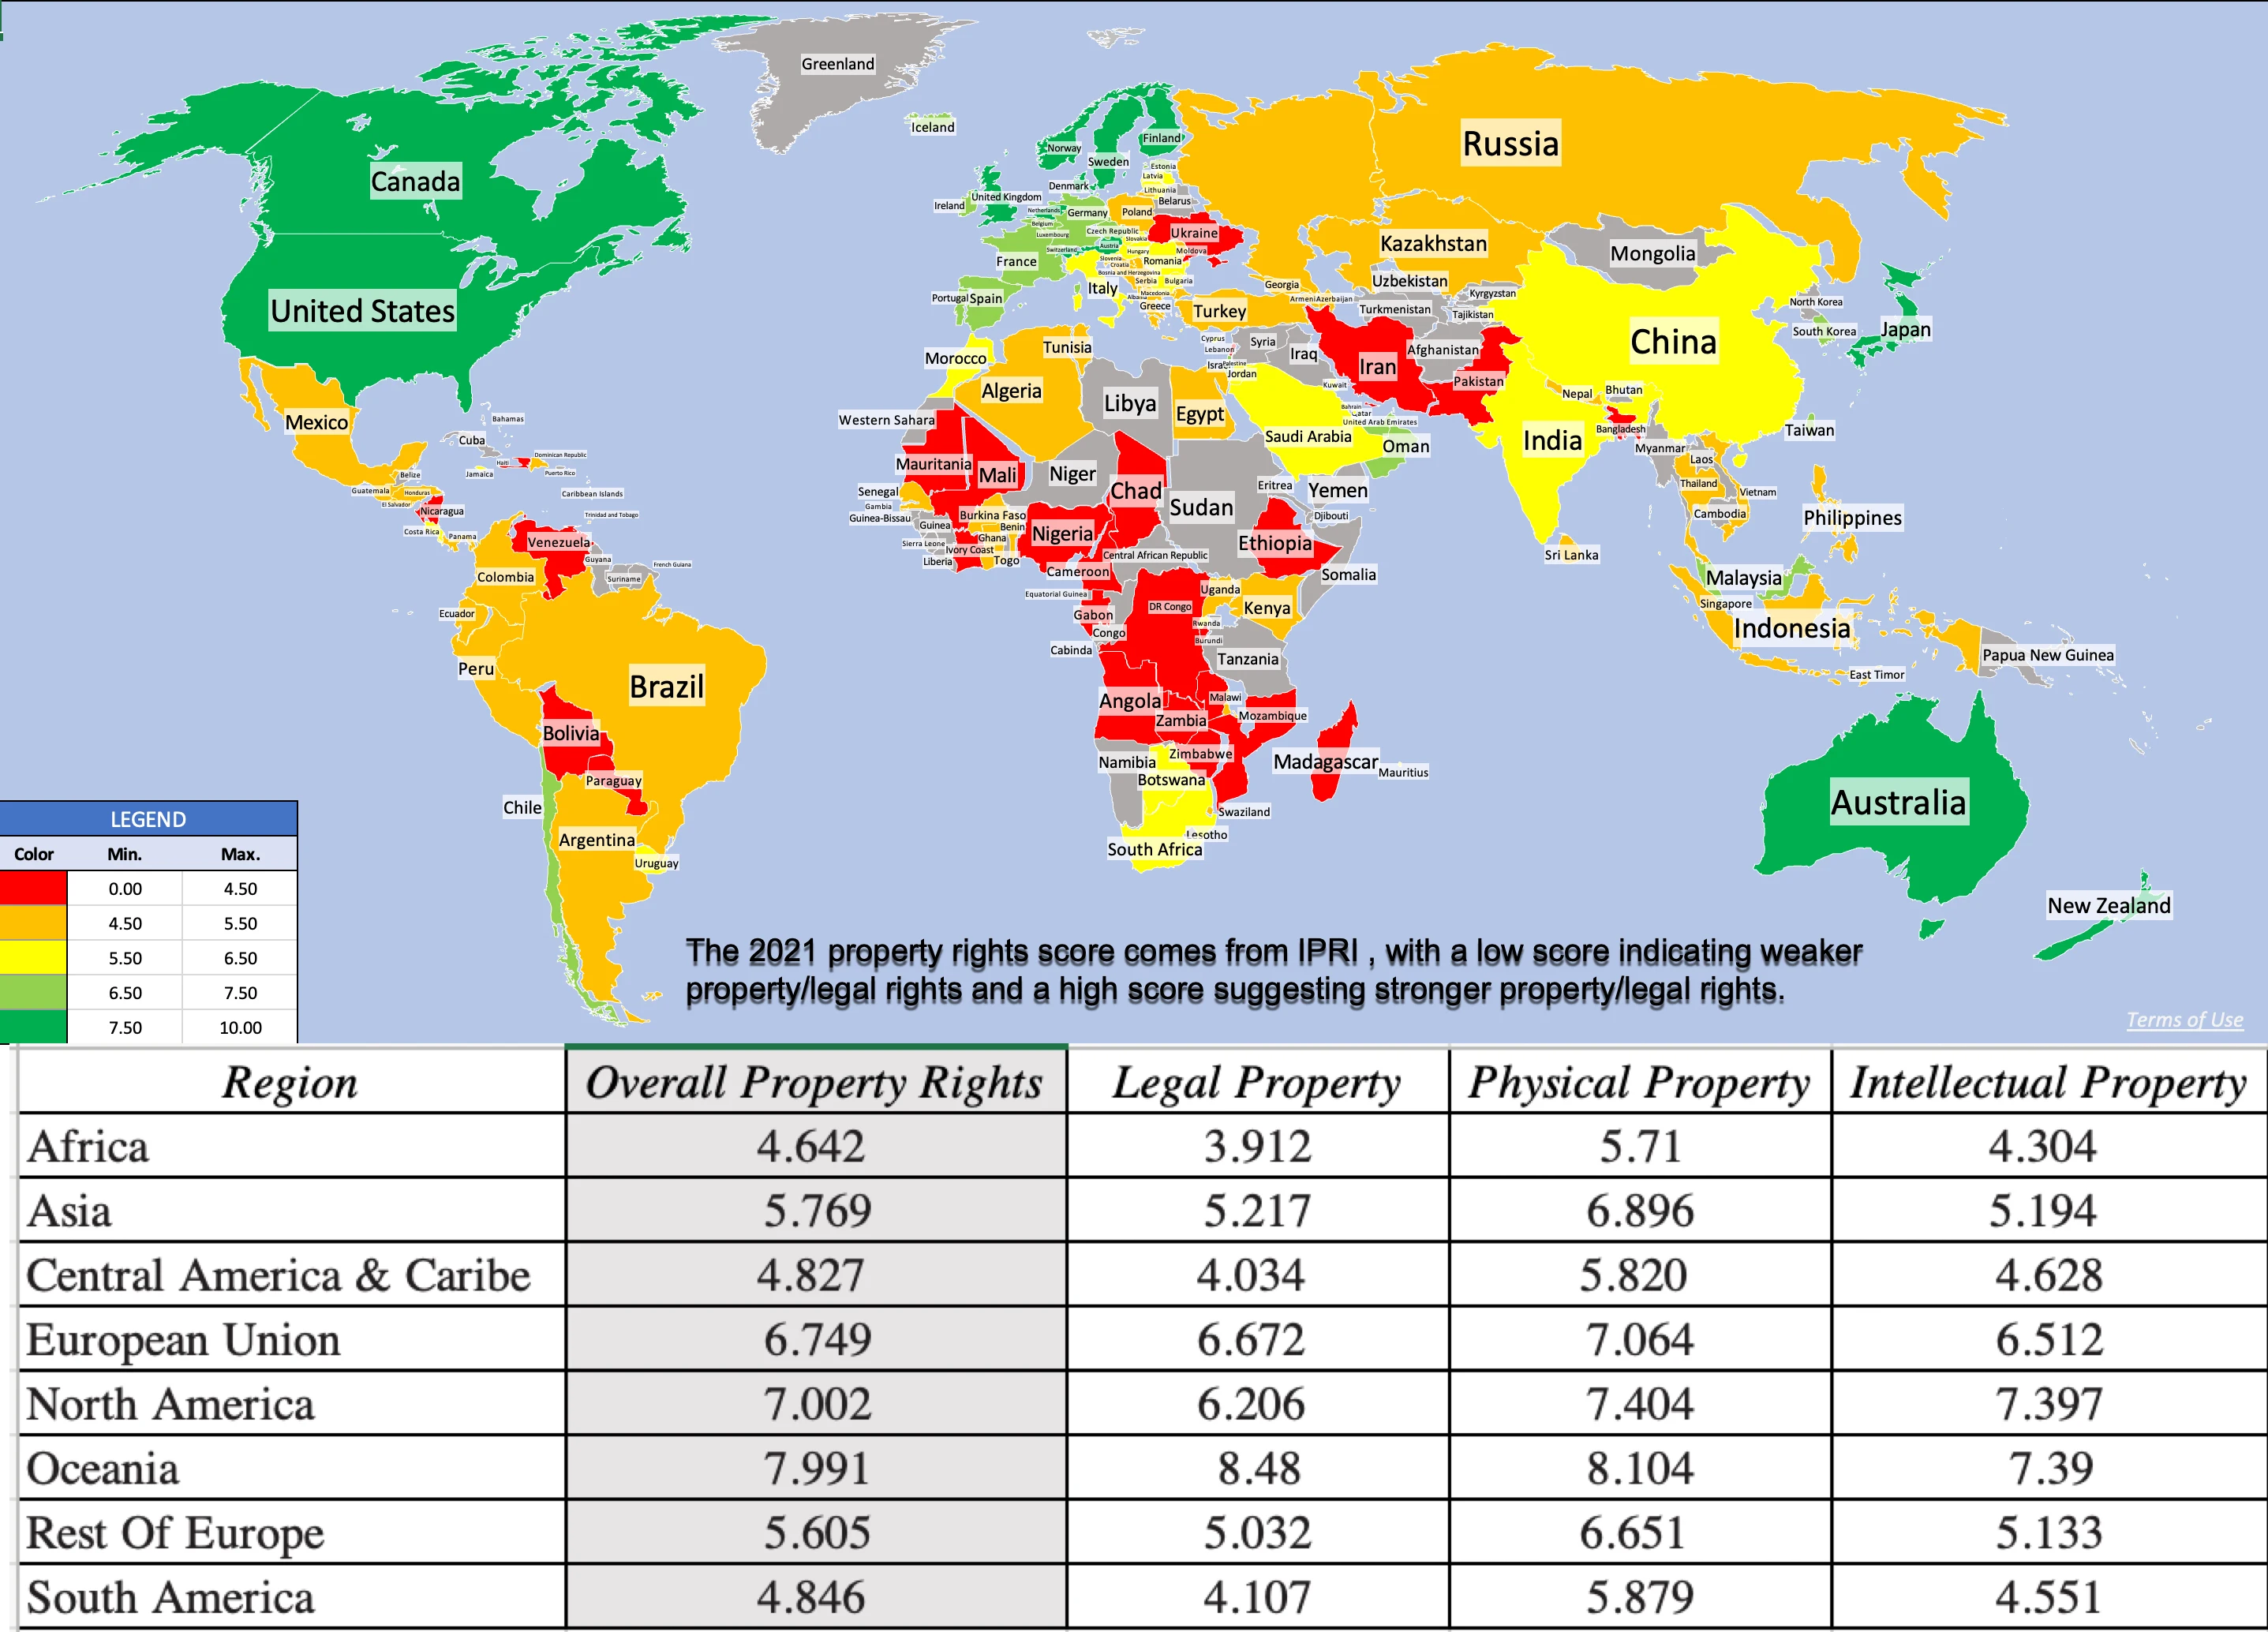
Finally, businesses are dependent on legal systems to enforce contracts and property rights, and legal protections vary widely across the world. I have mapped out an overall property rights score (based upon difference in physical, intellectual and legal property rights) below:
 |
| Source: International Property Rights |
Legal protections for businesses are strongest in Australia and North America and weakest in Africa and Latin America.
While country risk has so many dimensions to it, there is correlation
across the many dimensions, with corruption, poor legal protections,
violence and political instability often moving in tandem. There are
several services that attempt to estimate composite country risk scores,
incorporating the multiple factors. One of my long-standing favorites
is Political Risk Services, which measures a country risk score on a
scale from 0 to 100, with lower scores indicating more risk and higher
scores associated with safety:
Source: The PRS Group
Based
on the PRS composite risk measures, Africa remains the most risky
region of the world for businesses to operate in, whereas Northern
Europe, North America and Australia offer the most safety.
Country Risk: Default Risk and Ratings
For investors, the most direct measures of country risk come from
measures of their capacity to default on their borrowings. At the start
of 2022, for instance, there were several countries that were in
technical default, on at least portions of their debt, and the Russian
invasion of Ukraine has exacerbated sovereign default concerns around
the world:
Source: Bank of England
To
measure sovereign default risk, ratings agencies (S&P, Moody’s,
Fitch) estimate sovereign ratings for countries, designed to capture
risk exposure in both local and foreign currency borrowing. The picture
below reports on Moody’s ratings, as of June 30, 2022:
Source: Moody's
Note that this picture has been updated to incorporate Russia’s rating reassessment (downgraded to Ca in
early April, before the rating was entirely withdrawn). I know that
there are some of you, who distrust ratings agencies, arguing that they
have regional and other biases and/or that they do not adjust ratings in
a timely fashion. If you are in that group, the sovereign CDS market
offers market-based and real-time measures of sovereign default risk,
although for only 80 countries, and the map below reports the sovereign
CDS spreads, as of June 30, 2022:
Source: Bloomberg
Comparing
the sovereign CDS spread picture to the sovereign ratings picture, you
can see the overlaps, with the ratings agencies and CDS market mostly in
agreement.
Country Risk: Equity Risk
For
equity investors, the price of risk is captured by the equity risk
premium, and equity risk premiums will vary across countries. I use a
template that starts with the implied equity risk premium that I compute
for the S&P 500 and then adds on a country risk premium that is
computed based upon the sovereign default spread (either from the CDS
market or based upon a sovereign rating), to get equity risk premiums
for countries:
The
equity risk premiums that result from this assessment are shown in the
picture below, with a very rough attempt to break down countries
geographically. (Please do not attach any political significance to my
country groupings, or take them personally. I mean no disrespect to any
country, and if you feel your country has been mis-grouped, I
apologize.):
Source: Spreadsheet with country risk premium data (Damodaran Online)
If
you compare the numbers in this picture to the equivalent one that I
reported at the start of the year, you can see the surge in risk
premiums across the board, starting with a higher base premium (6.01%,
up from 4.24%) for the US and higher spreads for country risk. Looking
at individual countries, the graph below summarizes the countries that
saw the biggest increases in equity risk premiums (on a percentage
basis) over the six months (from Jan 1, 2022 - June 30, 2022):
Not
surprisingly, Russia and Ukraine make the list, with Russia's equity
risk premium almost tripling and Ukraine's doubling over the period, but
you can see the spillover effects into Belarus and Kyrgyzstan. There
are three African countries that make the list (Namibia, Mali and
Ghana), largely because of ratings downgrades, Sri Lanka's downgrade
reflects the implosion of its political system and El Salvador's
experiments with Bitcoin are not going well.
Country Risk: Currency and Cost of Capital
As
a final part to this post, to see the shifts in country risk that we
have seen in 2022, let’s start with an assessment of risk free rates. In
my last post, I noted that concerns about inflation have played a big
role in pushing up the US ten-year treasury bond rate from 1.51% on Jan
1, 2022, to 3.02% on June 30, 2022. That increase in interest rates is
not restricted to the US dollar, as local currency government bond rates
have risen around the world. In the graph below, I use these government
bond rates as a starting point to estimate riskfree rates in multiple
currencies, with adjustments for default risk in governments, using the
sovereign default spreads from the last section:
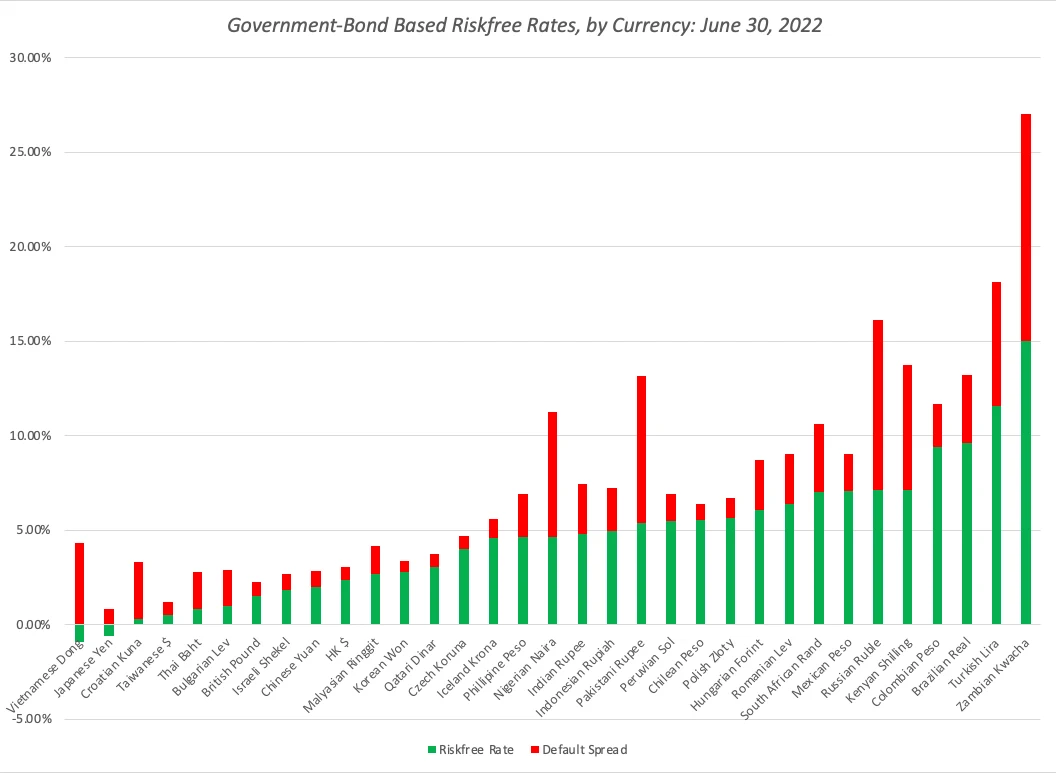
The
biggest reason for differences in risk free rates across currencies is
differences in expected inflation, with higher inflation currencies
exhibiting higher riskfree rates. That said, the key to dealing with
currency appropriately in valuation is to stay consistent, with cash
flows and the discount rates incorporating the same expectations of
inflation:
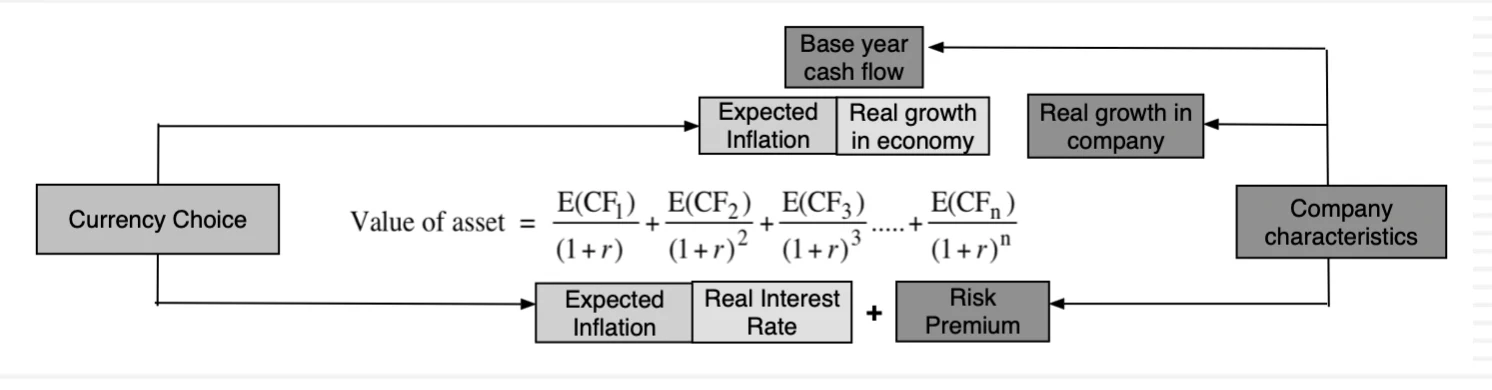
In
short, changing the currency that you use to value a company should not
fundamentally change your assessment of that company’s value, and the
reason that it often does in practice is because analysts are often
sloppy in their treatment of currency, mixing growth rates in one
currency with discount rates in another, and real with nominal numbers.
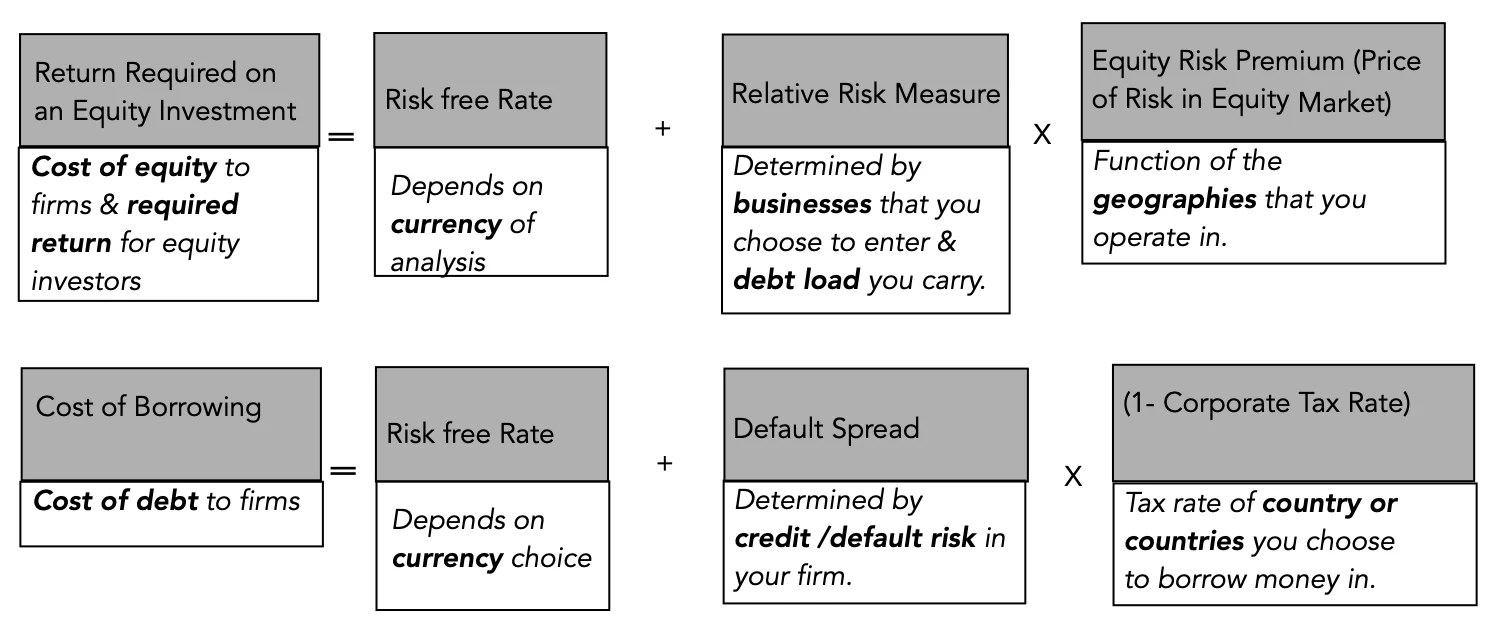
As a general principle, to prevent double or miscounting inflation
effects and risk, each input into discount rates carries a specific
component, with the riskfree rate being the conveyor of expected
inflation, the relative risk measure (beta for equity, bond rating for
debt) measuring the business and leverage risk of the company and the
equity risk premium/default spread reflecting the price of risk in
markets.
The
combination of rising risk free rates (not just in US dollars, but also
in other currencies) and surging risk premiums (default spreads and
equity risk premiums) is pushing up corporate costs of capital. In the
figure below, I graph the costs of capital for US and global firms, in
US$ terms, on July 1, 2022:
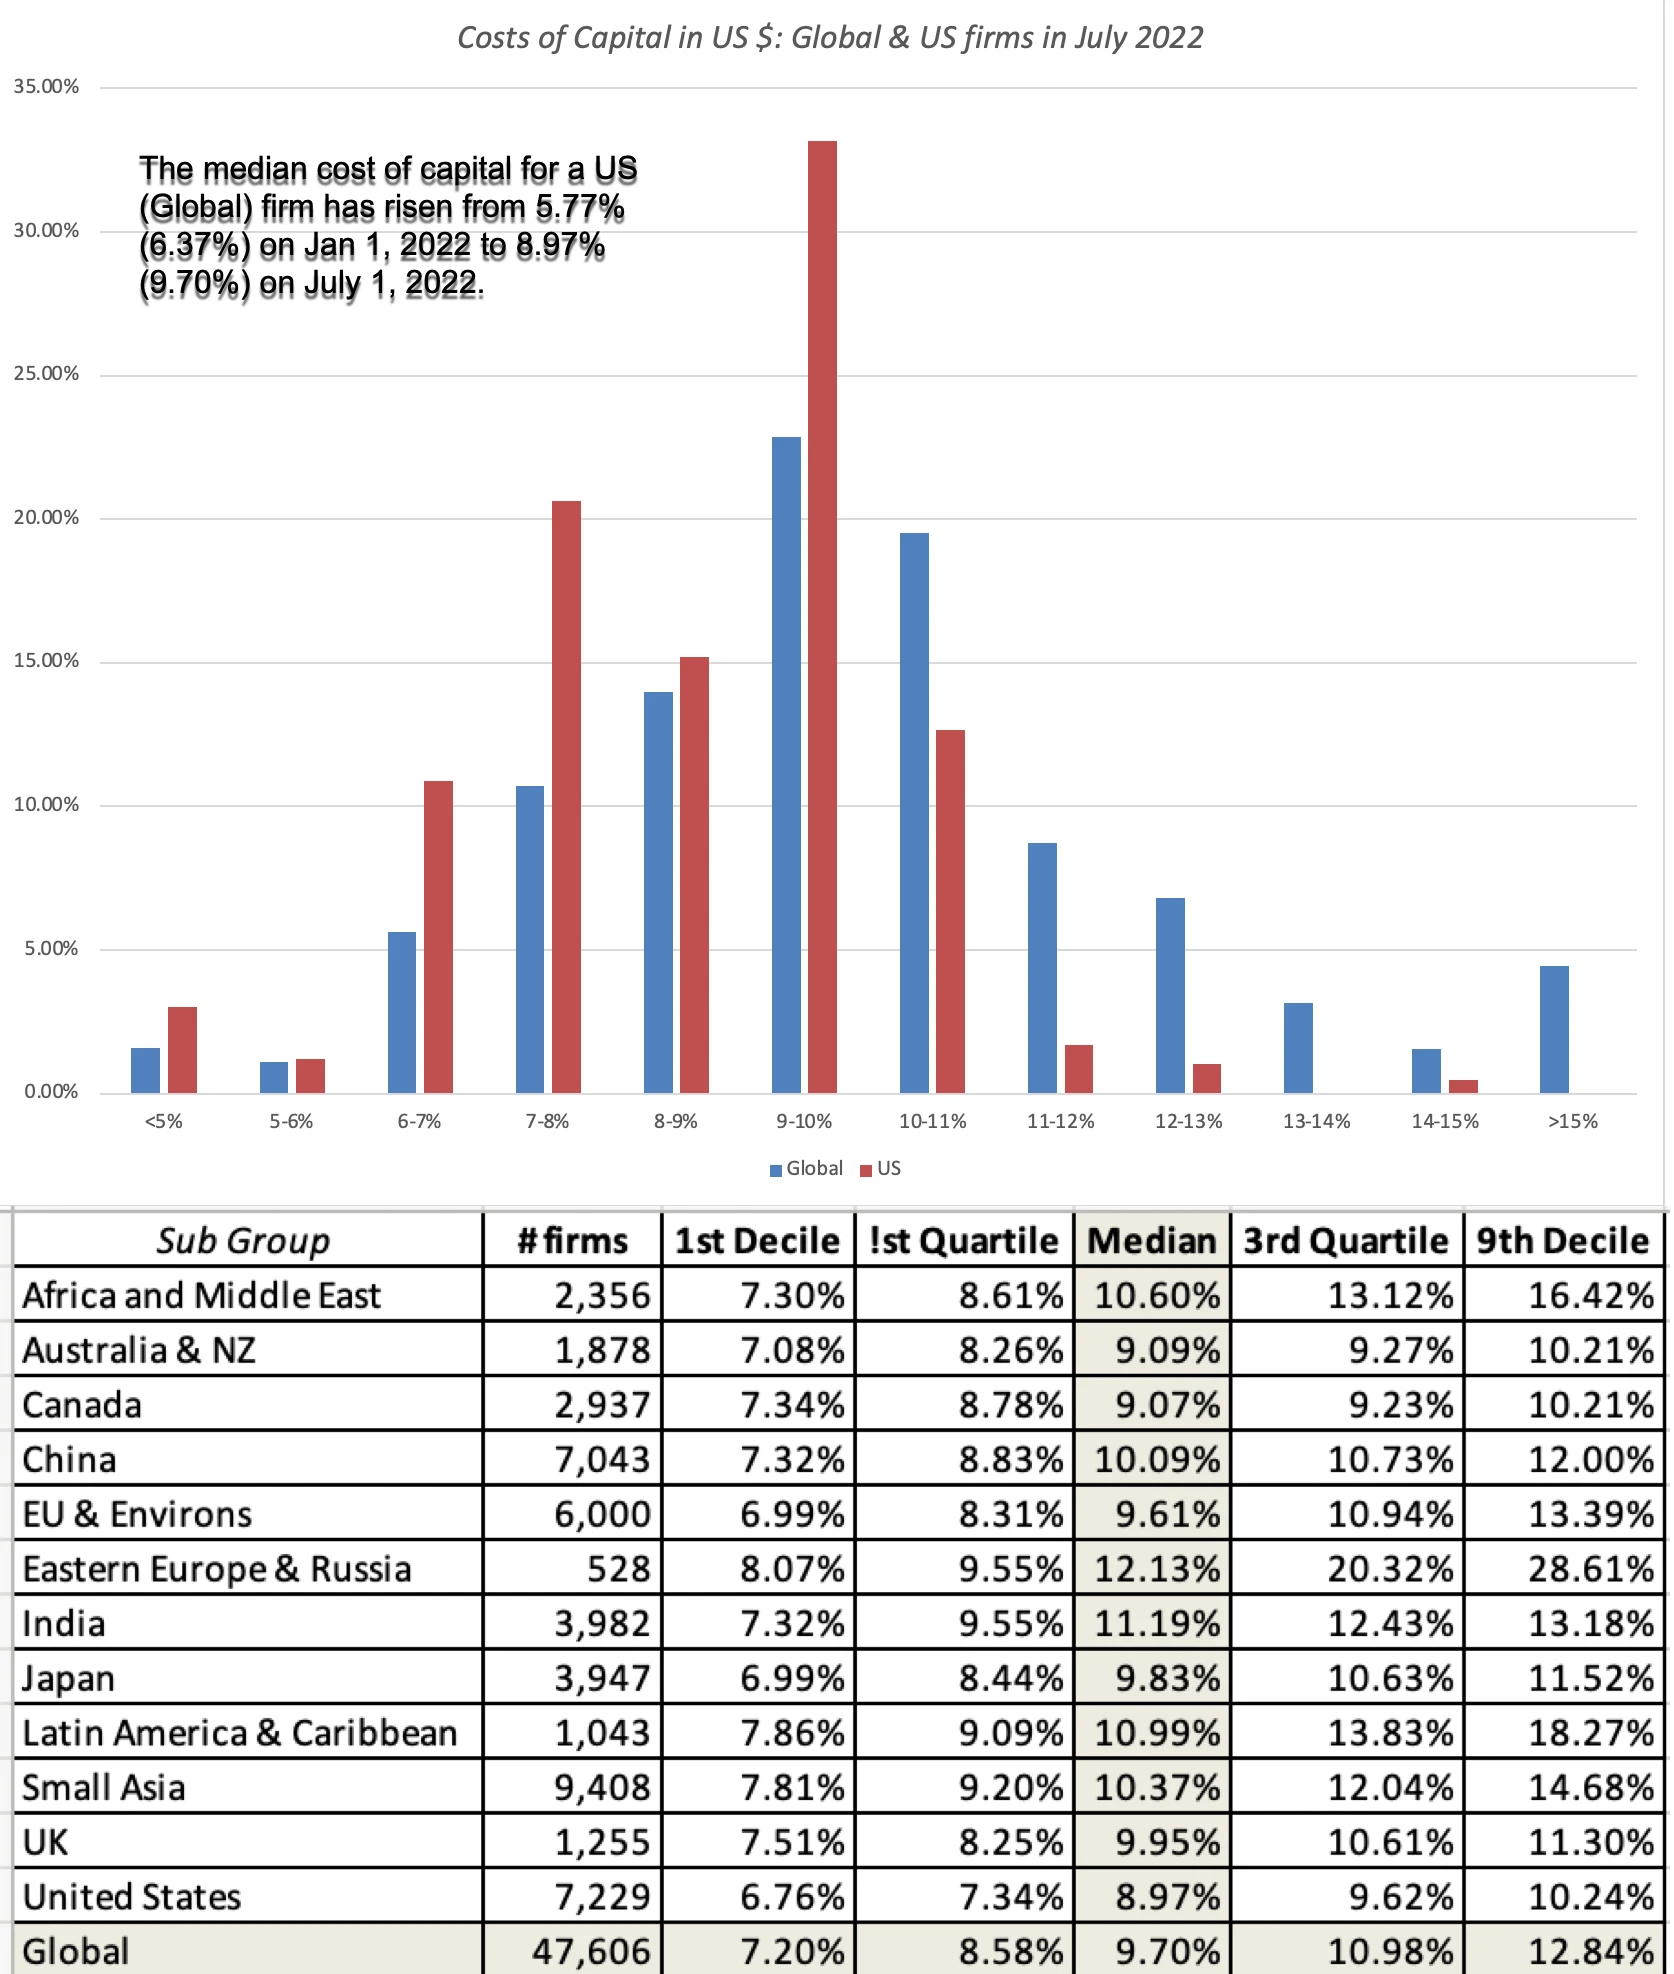
In
January 2022, I had posted a similar histogram of costs of capital for
global and US companies, reflecting risk free rates and risk premiums
then, and the change, over the six months, has been extraordinary, with
the median cost of capital for a US firm increasing from 5.77% to 8.97%,
and for a global firm, from 6.37% to 9.70%. As I look across the many
posts I have had this year on how inflation is changing market pricing
and psychology, I find myself drawing on one of my favorite Bob Dylan
lyrics, "the times, they are a'changin'". The biggest risk that we face,
as we navigate our way through uncharted territory, is inertia, where
we continue to do the things that have worked for the last decade, when
we need to adapt and change.


0 تعليقات